Issue Summary
Regional Public Universities
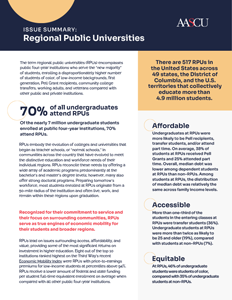
There are 520 RPUs in the United States across 49 states, the District of Columbia, and the U.S. territories that collectively educate nearly 4.9 million students.
The term regional public universities (RPUs) encompasses public four-year institutions who serve the “new majority” of students, enrolling a disproportionately higher number of students of color, of low-income backgrounds, first generation, Pell Grant recipients, community college transfers, working adults, and veterans compared with other public and private institutions.
70% of all undergraduates attend RPUs
Of the nearly 7 million undergraduate students enrolled at public four-year institutions, 70% attend RPUs.
RPUs embody the evolution of colleges and universities that began as teacher schools, or “normal schools,” in communities across the country that have evolved to meet the distinctive education and workforce needs of their individual regions. RPUs reconcile these needs by offering a wide array of academic programs predominantly at the bachelor’s and master’s degree levels; however, many also offer strong doctoral programs. Preparing tomorrow‘s workforce, most students enrolled at RPUs originate from a 50-mile radius of the institution and often live, work, and remain within these regions upon graduation.
Recognized for their commitment to service and their focus on surrounding communities, RPUs serve as true engines of economic mobility for their students and broader regions.
RPUs lead on issues surrounding access, affordability, and value, providing some of the most significant returns on investment in higher education. Eight out of the top 10 institutions ranked highest on the Third Way’s recent Economic Mobility Index were RPUs with price-to-earnings premiums for low-income students at percentiles above 94%. RPUs receive a lower amount of federal and state funding per student full-time equivalent enrollment on average when compared with all other public four-year institutions.
Affordable
Undergraduates at RPUs were more likely to be Pell recipients, transfer students, and/or attend part time. On average, 37% of students at RPUs received Pell Grants and 25% attended part time. Overall, median debt was lower among dependent students at RPUs than non-RPUs. Among students at RPUs, the distribution of median debt was relatively the same across family income levels.
Accessible
More than one-third of the students in the entering classes at RPUs were transfer students (33%). Undergraduate students at RPUs were nearly three times as likely to be 25 and older (17%), compared with students at non-RPUs (6%).
Equitable
At RPUs, 46% of undergraduate students were students of color, compared with 37% of undergraduate students at non-RPUs.
Educating the next generation.
In 2023, RPUs awarded 79% of all bachelor’s degrees in education and 79% of all total degrees in education earned at public four-year institutions.
Student outcomes at RPUs
66% of all bachelor’s degrees
In 2023, RPUs awarded 66% of all bachelor’s degrees and 67% of all master’s degrees earned at public four-year institutions.
Top fields of study in the 2022–2023 academic year:
- Business/communications and social/ behavioral sciences and human services for bachelor’s degree recipients
- Business/communications for master’s degree recipients
- STEM fields for doctoral degree recipients
- Health for professional practice degree recipients
RPUs AS MINORITY SERVING INSTITUTIONS (MSIs)
RPUs are much more likely to be MSIs. In FY24, 179 RPUs met eligibility requirements to apply for federal designation and funding for at least
one MSI type, compared with 19 non-RPUs. In 2022–23, among all public four-year institutions, RPUs enrolled:
- 86% of all Black or African American undergraduate students
- 78% of all Hispanic undergraduate students
- 71% of all American Indian or Alaska Native undergraduate students
- 67% of all Native Hawaiian or other Pacific Islander undergraduate students
- 58% of all Asian undergraduate students
Student Debt and Completion Outcomes
The average in-state tuition and fees among RPUs in the 2023-24 academic year was $10,007 on average for in-state, full-time undergraduates at RPUs. In academic year 2022-23, 59% of RPUs had a net price below $15,000, compared with just 28% of non-RPUs.
Pell Grant recipients may carry higher levels of total median debt than non-Pell recipients. However, due to overall affordability, Pell recipients at RPUs carry less median debt (42% under $15,000 total) than Pell recipients at non-RPUs (34% under $15,000 total).
Notably, median debt among dependent students (58% under $15,000) at RPUs is lower than their non-RPU counterparts (41% under $15,000).
RPUs tend to have a lower first- to second-year student retention rate and have a smaller four-year graduation rate when compared to other public four-year universities.
On average, 73% of full-time students enrolled at RPUs returned the following fall. Students at non-RPUs had higher retention rates with 88% returning to campus. The overall 150% graduation rate at RPUs (45%) is lower than at non-RPUs (63%). These data are rooted in a deeper message—it is imperative to understand the socio-economic circumstances surrounding student stop-out to work toward greater retention.
Data source
- AASCU analysis of College Scorecard and Integrated Postsecondary Education Data System data.
Questions about RPUs? Let us know.
"*" indicates required fields
