Issue Summary
Regional Public Universities
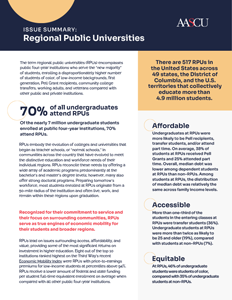
There are 520 RPUs in the United States across 49 states, the District of Columbia, and the U.S. territories that collectively educate nearly 4.9 million students.
Regional public universities (RPUs) are public four-year institutions that serve the “new majority” of students, disproportionately enrolling more students of color, those from low-income backgrounds, first-generation students, Pell Grant recipients, community college transfers, working adults, and veterans.
70% of all undergraduates attend RPUs
Of the nearly 7 million undergraduate students enrolled at public four-year institutions, 70% attend RPUs.
RPUs evolved from teacher-training normal schools and adapted to meet regional education and workforce needs. These institutions offer a comprehensive array of academic programs, predominantly at the baccalaureate and graduate levels; many also offer strong doctoral programs. Most students originate from within a 50-mile radius and remain in the region after graduation, directly supporting local workforce development.
Recognized for their commitment to service and their focus on surrounding communities, RPUs serve as true engines of economic and social mobility for students and the regions they serve.
RPUs lead on access, affordability, and value, delivering some of the highest returns on investment in higher education. Using College Scorecard data, Third Way’s Economic Mobility Index (EMI) evaluates institutions by comparing price-to-earnings premiums (PEPs) for low-income students with the percentage of Pell recipients enrolled. Public institutions consistently rank highest on the EMI, but RPUs lead the charge, holding all 10 top spots. 85% of all total RPUs are ranked in the most recent Index.
Doing More With Less: RPUs deliver measurable returns on investment for students, families, and communities, but that impact often comes at the cost of institutional capacity. RPUs receive, on average, $24,000 less in overall revenues per full-time equivalent student than non-RPUs. For in-state funding, RPUs receive $1,000 less per full-time equivalent student compared with other four-year public institutions. The cost shift, gradually brought about by public disinvestment throughout economic downturns, means students are shouldering twice the share of total costs at public institutions today than they did 20 years ago.¹
Affordable
Undergraduates at RPUs were more likely to be Pell recipients, transfer students, and/or attend part time. RPUs enroll 78% of all Pell recipients at public four-year institutions. On average, 37% of students at RPUs received Pell Grants and 25% attended part time. The average in-state tuition and fees for RPUs in Academic year (AY) 23-24 was $10,000.
Accessible
More than one-third of the students in the entering classes at RPUs were transfer students (33%). Undergraduate students at RPUs were nearly three times as likely to be 25 and older (17%), compared with students at non-RPUs (6%).
Representative
RPUs reflect the diversity of communities they serve. At RPUs, 47% of undergraduate students are students of color, compared with 36% at non-RPUs. RPUs remain committed to the importance of equal access not only as a moral imperative but also as a matter of workforce preparation, continued economic development, and increased international competitiveness.
Educating the next generation.
In 2022, RPUs awarded 80% of all bachelor’s degrees in Education and 80% of all total Education degrees were earned at public four-year institutions.
Student outcomes at RPUs
66% of all bachelor’s degrees
In 2023, RPUs awarded 66% of all bachelor’s degrees and 67% of all master’s degrees earned at public four-year institutions.
Top fields of study in AY22-23 by degree recipients:
- Bachelor’s: Business/communications and social/behavioral sciences and human services
- Master’s: Business/communications and education
- Doctoral: STEM fields
- Professional Practice: Health
STUDENT DEMOGRAPHICS AT RPUs
179 RPUs are MSI-eligible
RPUs are much more likely to also be Minority-Serving Institutions.² In FY24, 179 RPUs met eligibility requirements to apply for federal designation and funding for at least one MSI type.
As the nation’s population becomes more ethnically, culturally, and intellectually diverse, so do public institutions of higher education. In AY22-23, RPUs enrolled 4.9 million undergraduate students; 46% were students of color, compared to 37% of students at non-RPUs. That same year, public four-year institutions enrolled:
- 86% of all Black or African American undergraduate students
- 78% of all Hispanic undergraduate students
- 71% of all American Indian or Alaska Native undergraduate students
- 67% of all Native Hawaiian or other Pacific Islander undergraduate students
- 58% of all Asian undergraduate students
Student Debt
59% had a net price below $15,000
In AY22-23, 59% of RPUs had a net price below $15,000, compared with just 28% of non-RPUs.
Pell Grant recipients may carry higher levels of total median debt than non-Pell recipients. However, due to overall affordability, Pell recipients at RPUs carry less median debt (42% under $15,000 total) than Pell recipients at non-RPUs (34% under $15,000 total).
The overall median debt among dependent students at RPUs (58% under $15,000) was lower than at non-RPUs (34% under $15,000). Among students at RPUs, the distribution of median debt was relatively the same across family income levels.
Completion Outcomes
73% of full-time students
On average, 73% of full-time students enrolled at RPUs returned the following AY. Students at non-RPUs had higher retention rates, with 88% returning to campus.
First-generation and low-income students are more likely than their peers to consider leaving or to face dismissal, highlighting gaps in support. Cost is the most cited reason that students leave without a credential, followed by emotional stress and mental health challenges.
Stopped-out students state that additional financial resources (41%) may have helped them stay in college, as well as flexible class schedules (20%) and additional mental health resources (20%).
To improve retention and completion, policymakers, institutional stakeholders, and community partners must address the nonacademic barriers that impede student progress. Strategic investments in financial aid, flexible learning options, and comprehensive health and wellness supports can be decisive in determining whether students persist in their programs or stop out.
Data sources
- AASCU analysis of College Scorecard and Integrated Postsecondary Education Data System data.
- Sallie Mae & Ipsos. (2024). How America Completes College 2024.
Notes
¹ “Overall revenue” includes tuition, fees, state appropriations, local appropriations, federal appropriations, federal gifts and contracts, private gifts and contacts, investment returns, and ‘other’.
² These RPUs include 3 Alaska Native and Native Hawaiian Serving Institutions (AANH), 53 Asian American and Native American Pacific Islander Serving Institutions (AANAPISI), 99 Hispanic Serving Institutions (HSI), 11 Native American-Serving Nontribal Institutions (NASNTI), 8 Predominantly Black Institutions (PBI), 40 Historically Black Colleges and Universities (HBCU), and 2 Tribal Colleges and Universities (TCUs).
Questions about RPUs? Let us know.
"*" indicates required fields
